XGrid
Mark books withthe formulasyou already know.
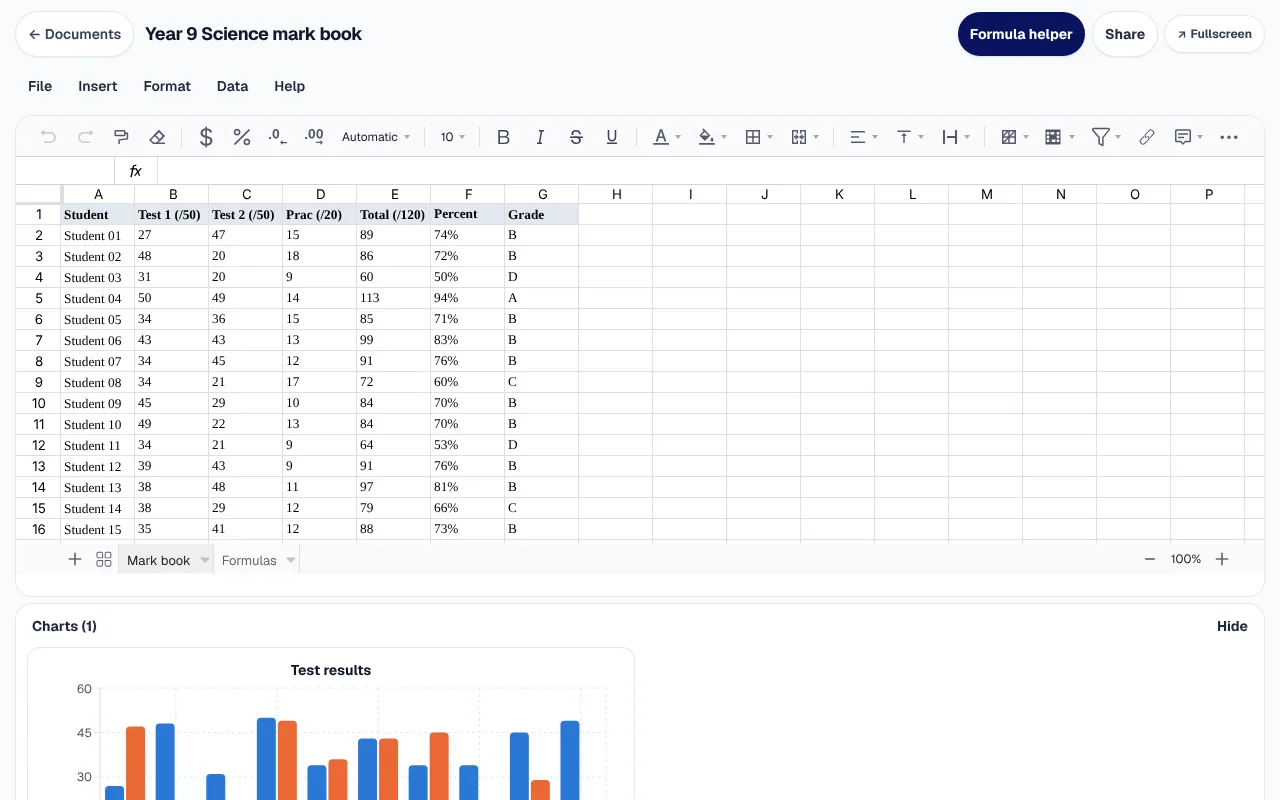
Mark books live on one tutor's laptop, and admin staff chase them before every parent meeting. XGrid is the spreadsheet inside your centre's portal. VLOOKUP, SUMIFS and XLOOKUP give Excel's answers, Excel files open and save back, and the mark book sits beside the rest of the centre's work.
In your portal: Spreadsheets
Top student
90+
functions rebuilt to give Excel's answers
5
ready-made sheets
5
kinds of chart
3
file types it opens
Secure by design
Results stay in your portal.
When a tutor leaves, their spreadsheets usually leave with them. Here mark books, rosters and budgets sit with the rest of your centre's work, behind the sign-in your staff already use.
Results stay with your centre
Mark books and rosters live in your centre's own portal and are shared with colleagues to edit or to view, not kept in a personal cloud drive.
Stored in Sydney, Australia
Every sheet and earlier version is stored in Sydney, Australia. The formula helper sends your column headings and the kinds of values, never the people in the rows, and that text may be processed outside Australia.
No extra licences
XGrid is part of your portal. There is no separate spreadsheet program to buy for each tutor, and nothing to install.
Sharing that keeps children safe
A sheet shared between a member of staff and a child goes to the child's parents too, always, and your centre's compliance staff can read what was shared.
Formulas
The formulas you know. Excel's answers.
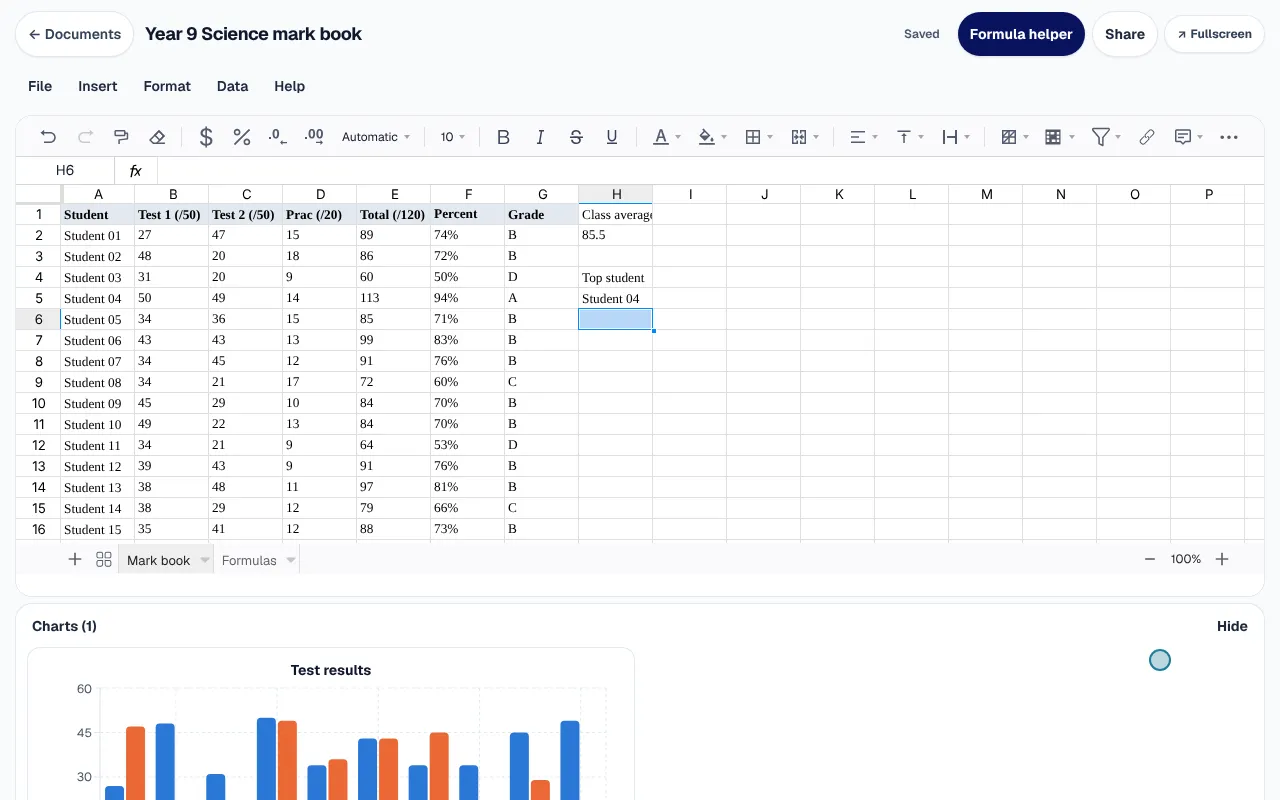
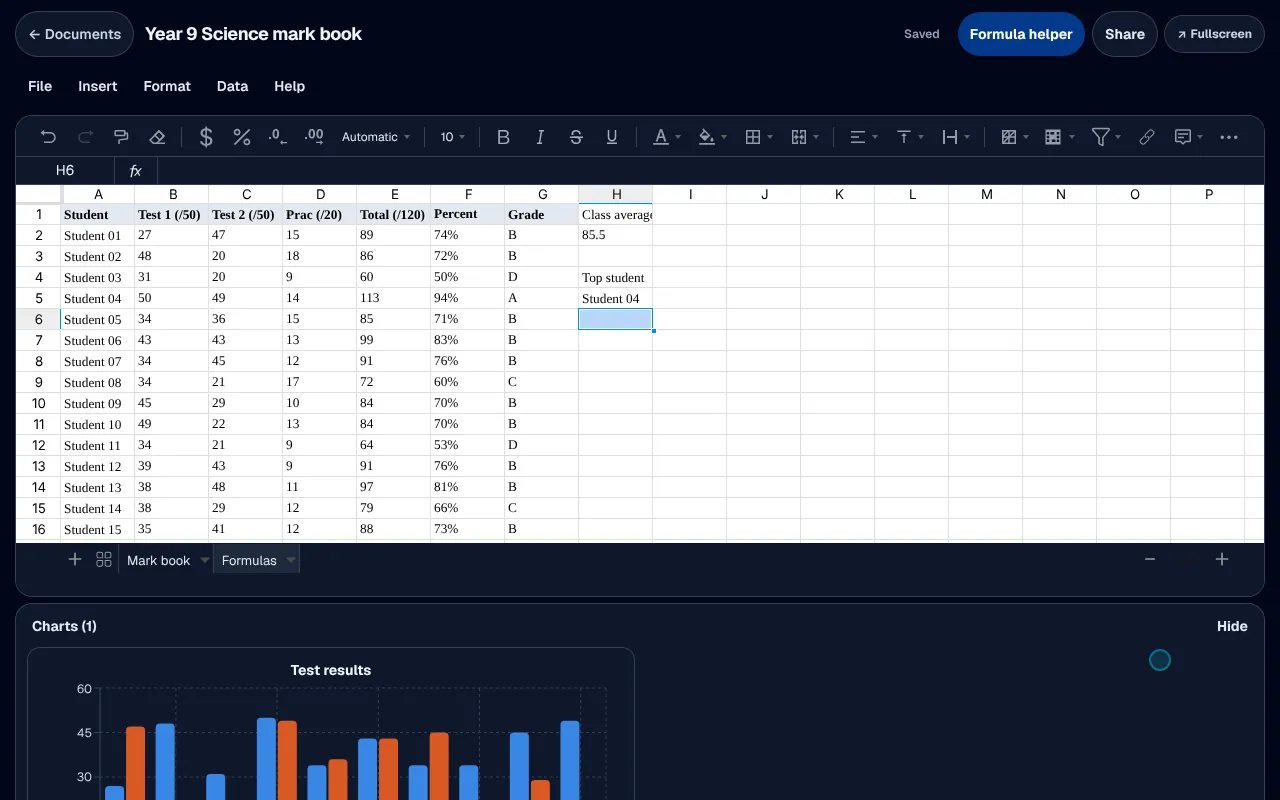
Tutors who know their spreadsheet formulas stop trusting a tool that answers differently. Type a formula the way you would in Excel. VLOOKUP with FALSE, IFERROR, SUMIFS and XLOOKUP give the answers Excel gives, and the mark book recalculates as you type.
- 01XLOOKUP, XMATCH, MAXIFS, MINIFS and TEXTJOIN
- 02TRUE and FALSE work in every lookup
- 03Formulas in an imported workbook recalculate
Statistics
Statistics, done the way maths teachers expect.
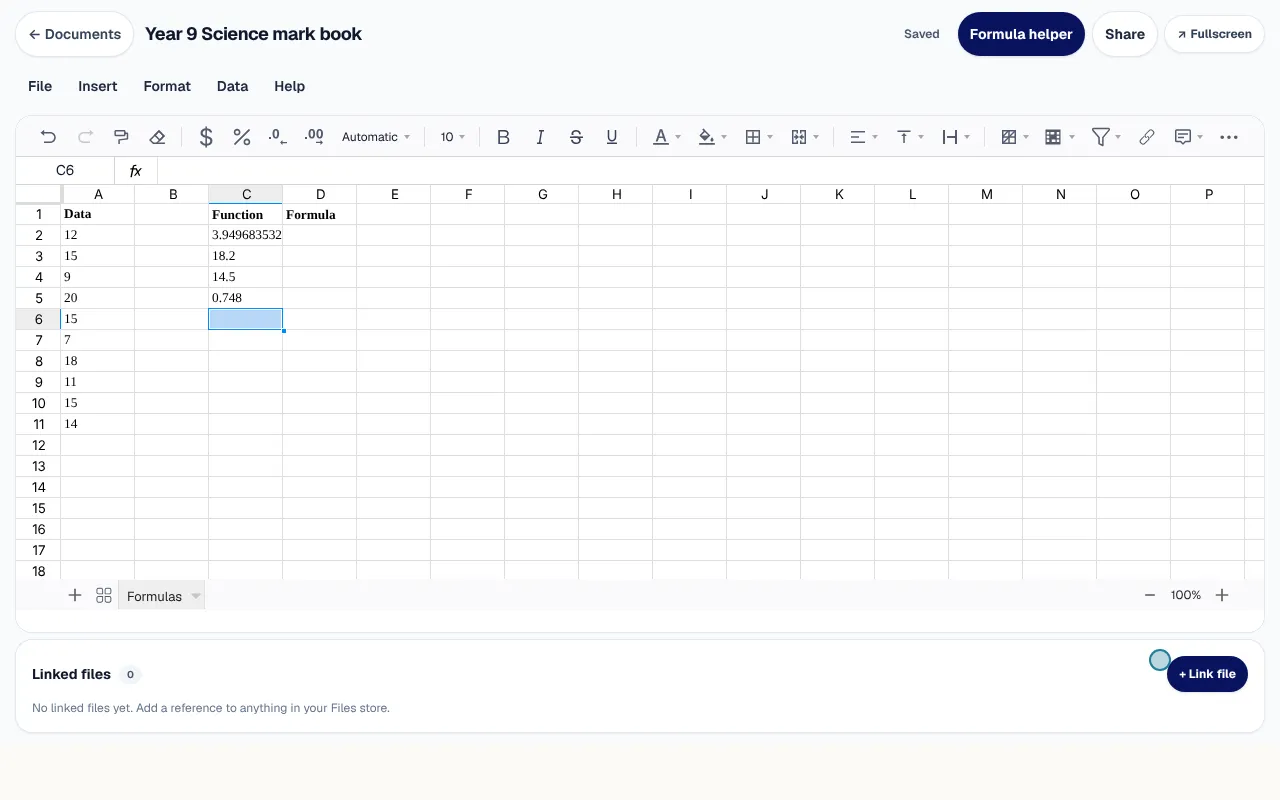
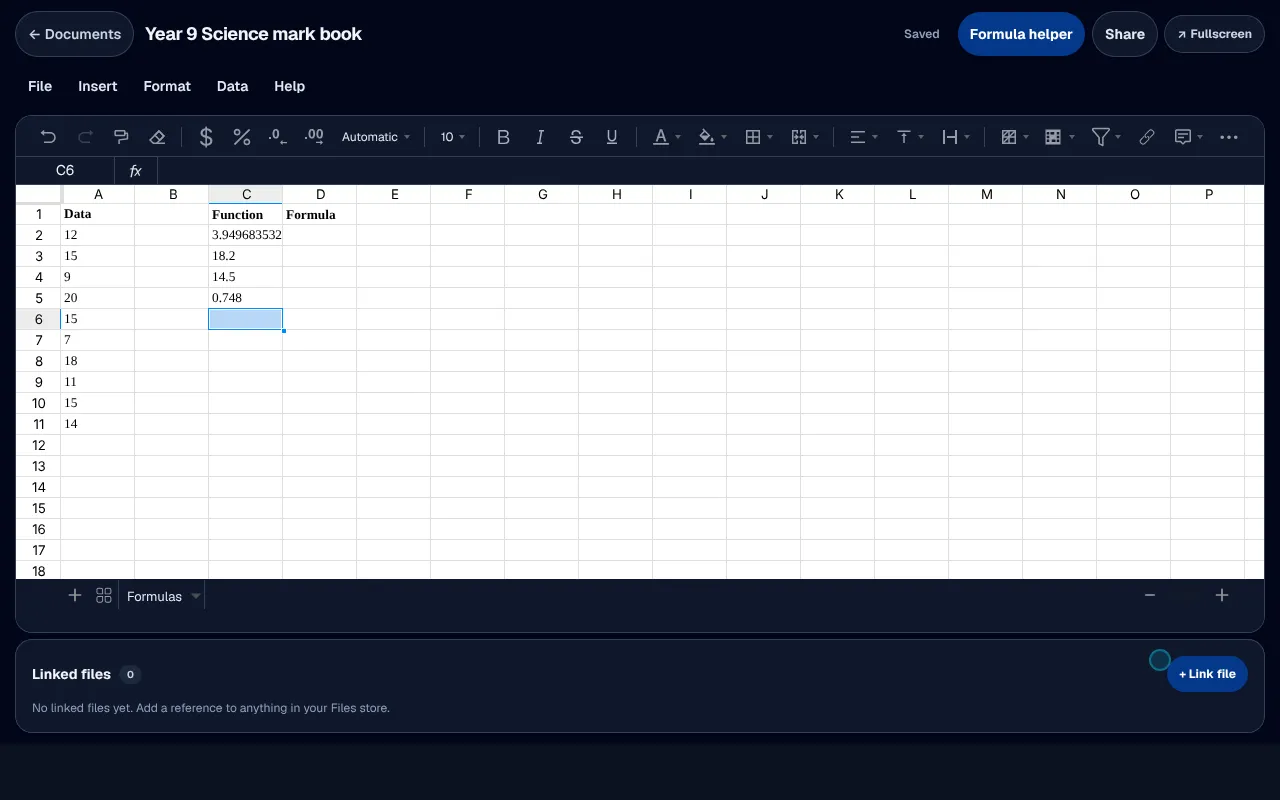
A maths tutor checking a class's spread cannot afford a percentile that is quietly wrong. STDEV.S, PERCENTILE, MEDIAN and NORM.DIST work under their dotted names, and PERCENTILE is the inclusive one Excel uses.
- 01STDEV.S, VAR.S and their population partners
- 02PERCENTILE and QUARTILE, inclusive and exclusive
- 03NORM.DIST, BINOM.DIST and POISSON.DIST
Charts
A chart from the results, ready for the parent meeting.
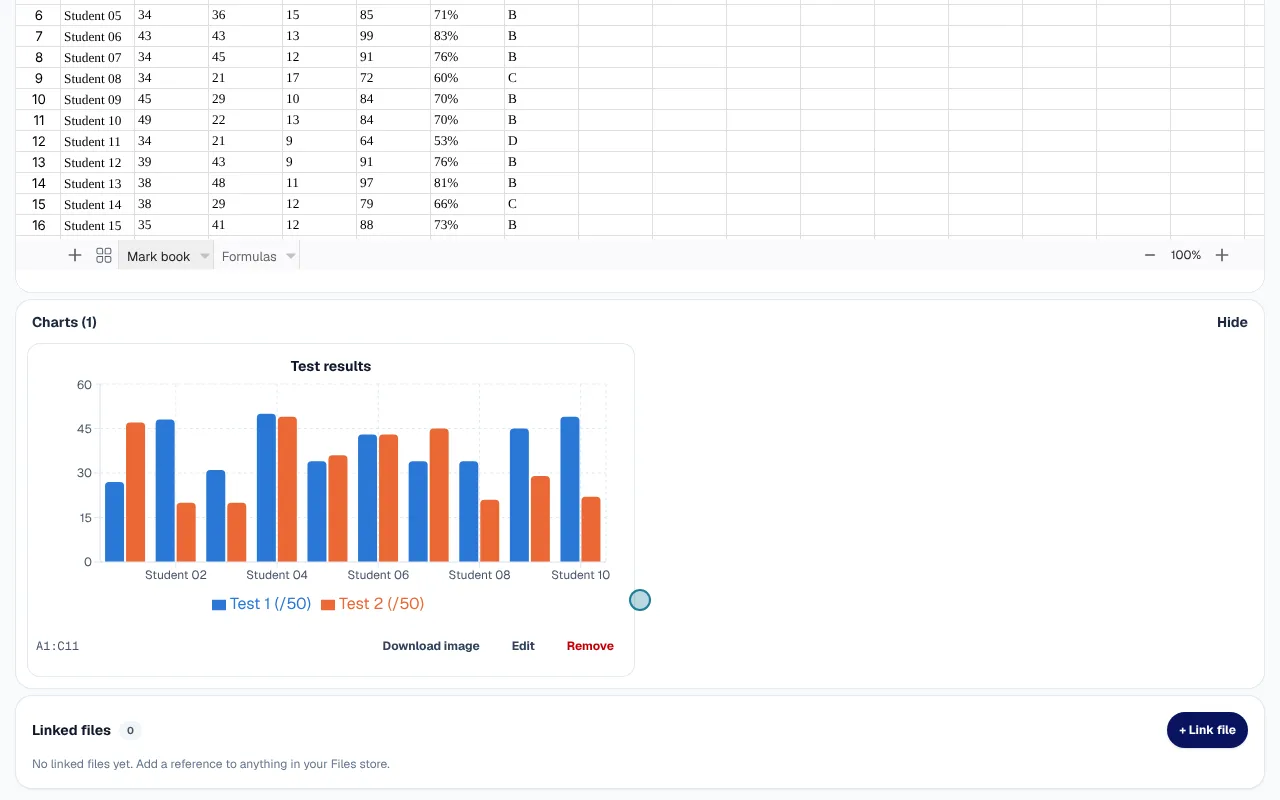
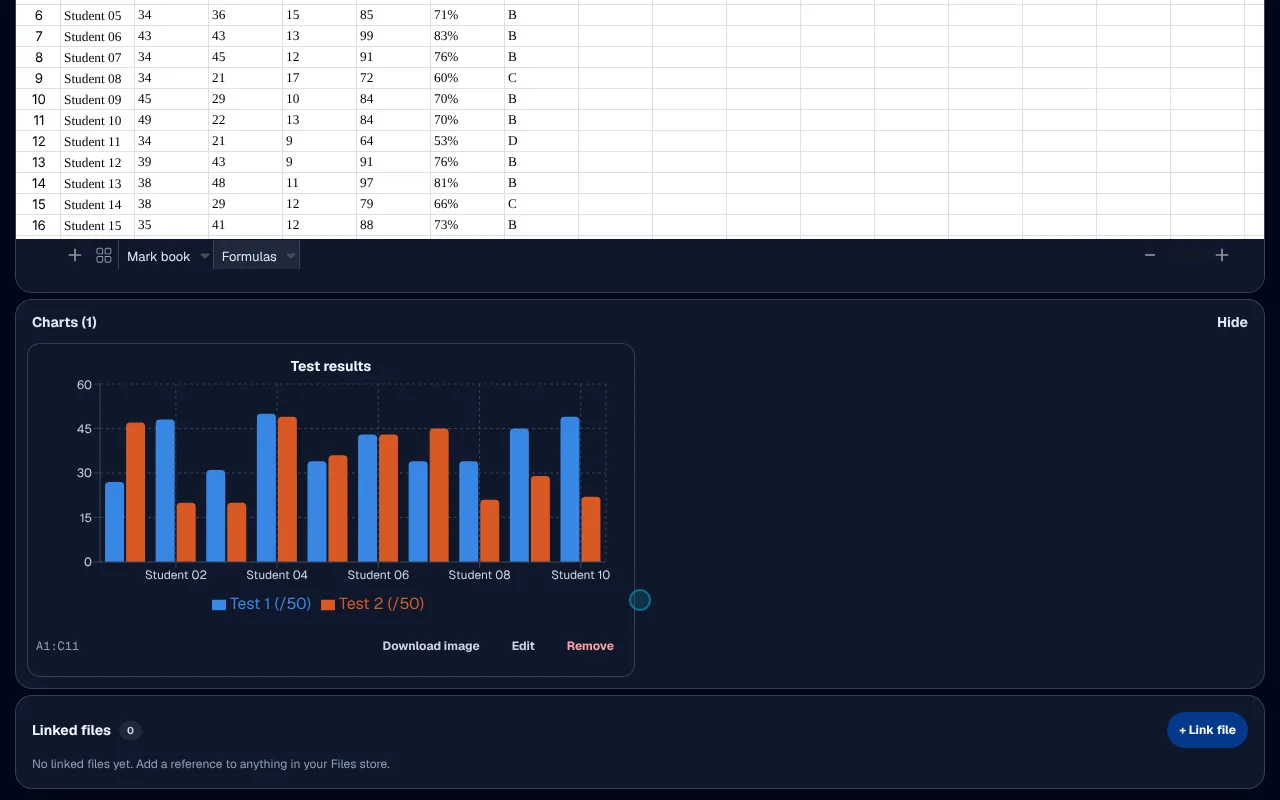
Parents follow a picture of the term far more easily than a column of marks. Select the results and draw a column, bar, line, scatter or pie chart. It sits under the grid, downloads as a picture, and a deck or a document can use it.
- 01Five kinds of chart
- 02Download the chart as a picture
- 03Use it in XDeck and XWrite
Excel files
Excel in, Excel out.
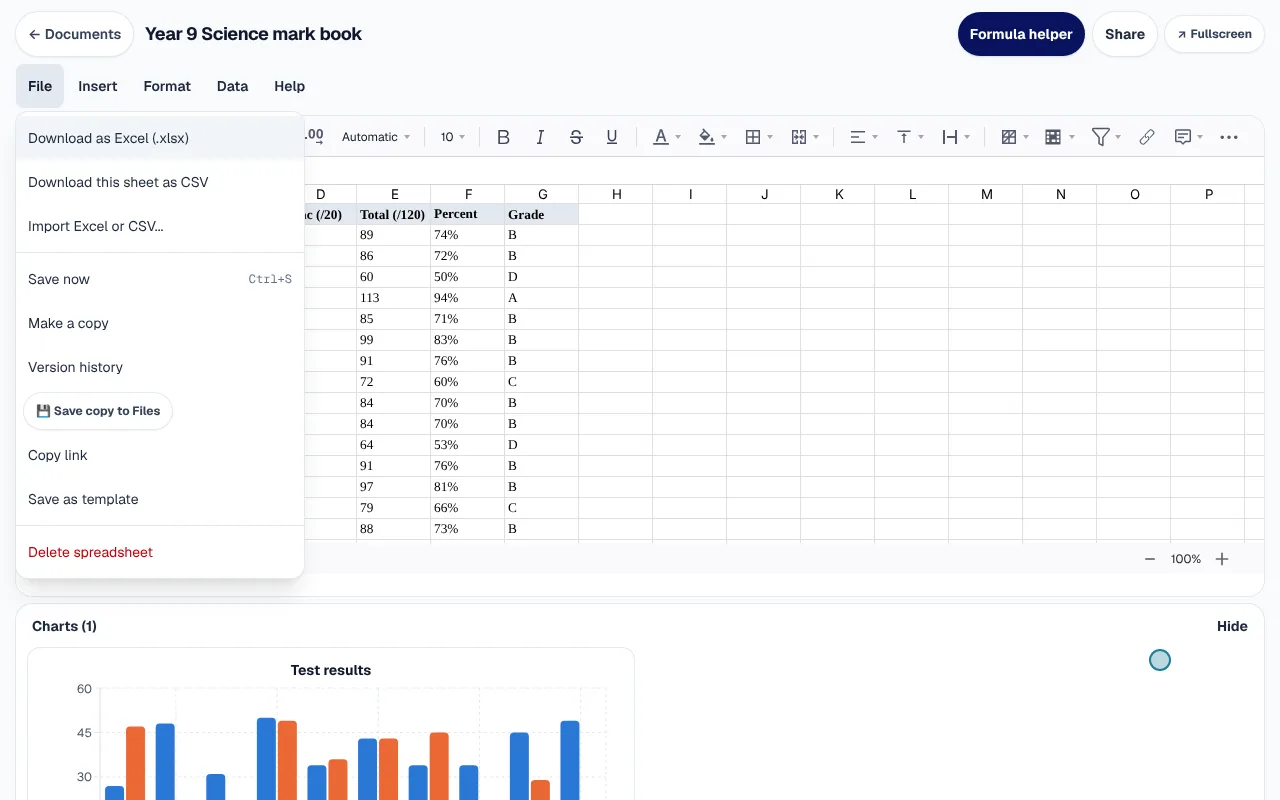
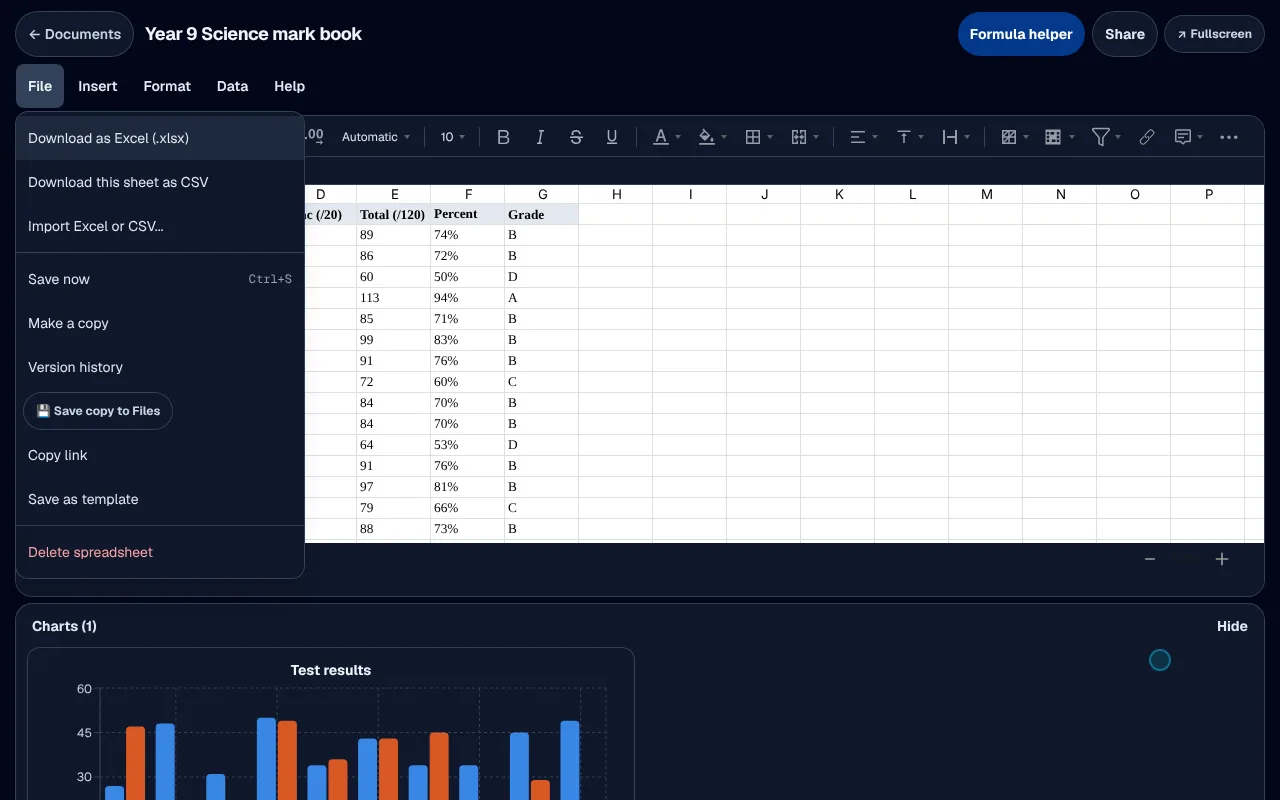
Admin staff should not have to retype last year's roster to start a new term. Import last year's workbook and keep working from it, then download it again when someone needs the file.
- 01Styles, number formats and merged cells
- 02Column widths, frozen panes and borders
- 03Simple conditional formats, both ways
Built for tutoring
In a centre's week.
- A tutor keeps a class's test results in the portal and charts the term for the parent meeting, with nothing to send to anyone first.
- Reception imports last year's Excel roster and works from it on day one, instead of retyping it.
Your files
Import Excel (.xlsx), CSV or tab-separated files and download as Excel (.xlsx) or CSV. Styles, number formats, merged cells, column widths, frozen panes, borders and simple conditional formats come across both ways.
Everything else, in brief.
The formulas you know
VLOOKUP, IFERROR, SUMIFS and the rest, plus XLOOKUP, XMATCH, MAXIFS, MINIFS and TEXTJOIN.
Statistics done properly
STDEV.S, NORM.DIST and the other dotted names work, and PERCENTILE is the inclusive one Excel uses.
Charts
Draw a chart from a range and it sits under the grid, ready to drop into a deck or a document.
Excel files in and out
Import a workbook and download it again with its styles, merges, widths and frozen panes intact.
Several sheets
Add, rename and reorder sheets, and download any one of them as CSV.
Mark book tools
Drop-down lists, Yes or No checkboxes and colour scales from the Data menu, and all three go to Excel and back.
Formula helper
Describe what you want and get a formula; it sees your column headings and the kinds of values, never the people in the rows.
Formatting and filters
Number formats, borders, fills, merges, sorting and filters from the toolbar.
Shared with your centre
Share a sheet with a colleague to edit or to view, with version history behind it.
 XWrite
 XDeck
XDeck XInk
XInk XInbox
 XMeet
XMeet XLesson
 XStudio
In short
XGrid
XGrid is the website's name for Spreadsheets, built into every XTutio centre's portal. Mark books and rosters with the formulas you already know. Staff use it with the same sign-in as the timetable, families and billing, and it costs nothing extra.
Questions centres ask
What is XGrid?
XGrid is what this website calls Spreadsheets in a centre's XTutio portal. Mark books end up on one tutor's laptop, and admin staff ask for them by email before every parent meeting. XGrid is the spreadsheet inside your portal: it speaks the formulas your staff already use, opens their Excel files and saves them back, so a mark book, a roster or a budget sits where the rest of the centre's work is.
Does XGrid cost extra?
No. XGrid comes with every XTutio centre, with nothing to buy per member of staff.